Strata 2012 Attendee Analysis
The Strata Conference is next week, so I was browsing the attendee directory curious to see who I know is going or looking for interesting companies to meet with. This got me thinking about the overall connectedness of the attendee list. So…A few scripts later and a bit of analysis I produced the following data, which probably could get thrown into a fancy infographic with 64pt fonts and cute icons, if that’s how you roll. Here’s a few stats and the process and tools used.
Stats:
1,463 attendees in directory1
Most Popular Titles
- CEO (61)
- Software Engineer (55)
- CTO (45)
- Founder (35)
- Data Scientist (33)
Note: Title data is very wonky due to no standards and multiple entries per line such as “Founder/CEO and Data Scientist" and people getting cute such as “CIO at Large" – I massaged a little, removing ranks (Senior, Sr., Principal, Lead) separating roles, etc… but gave up after awhile too chaotic.
Top Companies Attending
- Microsoft (48)
- EMC (19)
- Cloudera (14)
- Google (14)
- Karmasphere (11)
- LinkedIn (11)
Microsoft is obviously taking big data seriously, or just has a large training budget.
Twitter Analysis
The attendees also could include their twitter accounts, 454 of them did^1^. Analyzing the Twitter accounts of who follows who between attendees, gave me the above graph and some more interesting stats, such as the level of connectedness between conference attendees.
Average Degree: 9.615
The degree is the average number of connections per node, a node being a person in the graph. It will be interesting to see what the numbers look like after the conference to see to what level this connectedness changes.
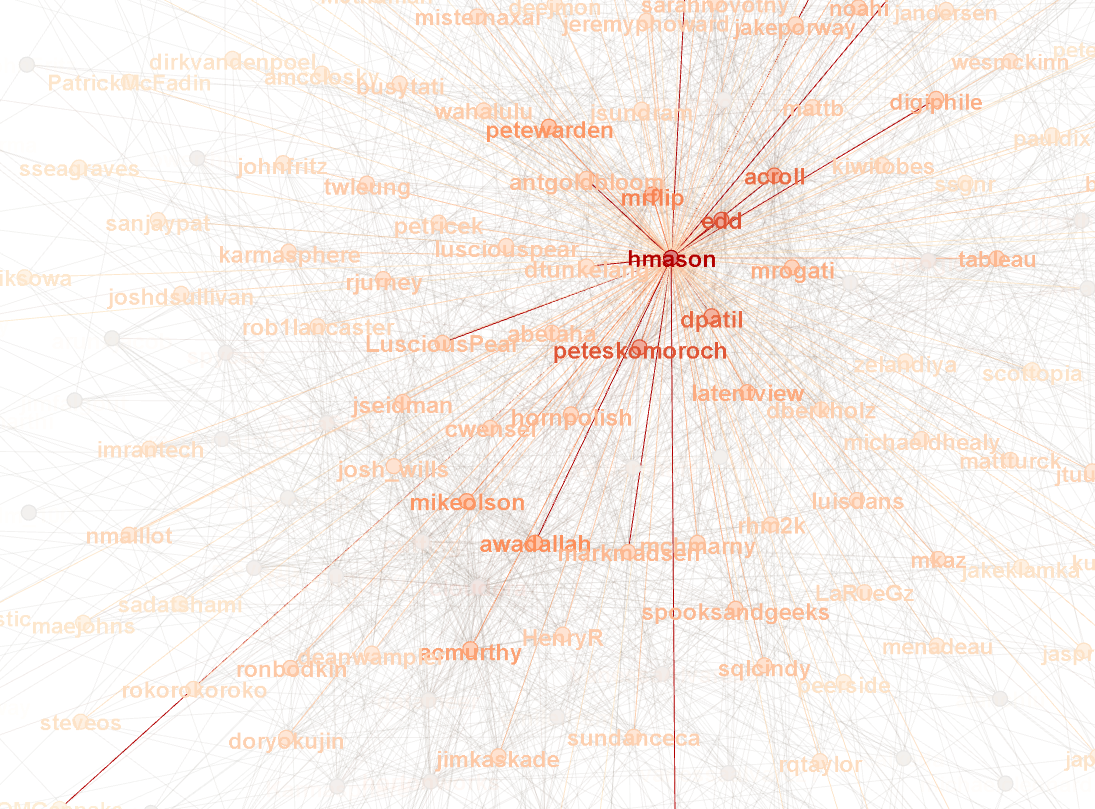
Largest Twitter Hubs
Process
First I created a quick ruby script to suck down all the attendees and their Twitter accounts. I used the Watir Webdriver tool which is intended for functional testing of web sites; but works quite well as a screen scraper since it has complex parsing and selectors.
This gave me a list of 1,463 attendees in the directory of which 454 listed twitter accounts.
I used this list of twitter accounts to feed a script which fetched who they follow. This was a bit of a pain due to rate limiting by Twitter to only 150 requests per hour. The graph of the twitter connections contains 454 nodes with 2,778 connections, or edges.
I created a GraphML file of the twitter data and pulled that into Gephi to create the graph. Gephi is a really cool tool, made it super easy to graph and calculate various data such as the degree. I need to brush up more on my graphy theory to understand it all.
My typical process is to write everything to local data files, this allows for easier manipulation and wider variety of tools can be used to massage the data. So even the initial HTML I sucked down from the attendee directory once and then tweaked my script to get it to parse properly. Otherwise I’d be hitting the server frequently which would just be annoyingly slow, since it takes me about 100 iterations to parse anything properly.
For the twitter accounts, I created a file for each user and stored the IDs of who they followed. I could then run various scripts against that. A simple wc -l on the directory tells me who follows the most users.
In files, I can also easily massage the data using many standard unix functions such as awk, cut and vim. For example the initial listing I spit out into a pipe delimited format:
Name | Position | Company | Twitter
I used cut to pull out twitter accounts and then vim to delete blank lines
cut -d'|' -f4 < twitter.txt
vim twitter.txt
:g/^s*$/d
The GraphML format turned out to be one of the easiest parts, basically each person is a node and each connection another node. So putting it together was just outputting one XML file:
<graphml>
    <graph>
    <node id="mkaz" />
    <edge source="mkaz" target="edd"/>
    <edge source="mkaz" target="cutting"/>
    ...
    </graph>
</graphml>
1 All data gathered on Weds, Feb 22, 2012