Strata Data Conference Recap
This last week I attended the inaugural Strata Conference, a conference titled “making data work”. It broke into a few different tracks, (1) handling big data, scaling infrastructure, for example hadoop and cassandra systems, (2) data visualizations, how to present data, graphics and tons of examples and (3) data sets and cool shit you can do with data. I focused most of my time around (2) and (3), I’m not that interested in operations of big data, but I prefer the analyzing and doing something with the data more.
Here’s a brief recap of the conference from my view plus links to good information and further exploration. The next Strata conference is in New York in September and they already plan to bring it back to the Bay Area next year. More info at O’Reilly
Data Visualizations
I went to several talks on presenting data and visualizations, unfortunately most were around advice and theory and less specifics around the tools and how they do it. The talks were still really informative and inspiring to see so many of the great things being worked on and developed. The main advice was to Have a Message, the data itself is not the message, but can help reveal it. Don’t focus so much on data, but on the story it tells or the action it motivates.
data is a dish best served raw
A slightly contrarian view to having a message was to provide the user with the tools to explore the data. Allow the user to be able to create their own stories from the data. This all depends on the data set, do not expect users to derive the same message from the same data. Everyone brings different views and analytical abilities when looking at data and visualizations.
Exploration works better when the user can create their own story by focusing on area that concerns them, for example their own geographic region. If you are trying to convince a decision maker for a specific result, raw data and exploration is probably not your tool.
Keep it Simple – Reduce chart and table junk from your graphics, increase the data-to-ink ratio. Here’s an example the Juice Analytics people showed on simplifying a table of MLB Team salaries. You can see below even at this smaller size which one would be easier to read.
Here are a couple of pretty cool visualizations from the Guardian, who also provide the raw data alongside. It is really worth checking out their data site and blog for inspiration as well as data to play with, a great resource. The Carbon Calculator is particularly interesting tool to use and play around with.
World Carbon Dioxide Emissions
Finally in the Data Visualization category, I leave you with Data as Art which is a great collection of beautiful data visualization examples put together by JJ Toothman. Explore his presentation and the collection of links he put together.
Advice
Clean data > More Data > Fancy Math – this is the order which makes data easier and better to work with. Clean data will be easier to work with and provide best results. If your data isn’t clean, it is better to have more data than having to resort to fancy math. Using higher order statistical processing, why workable as a last resort, will require longer to develop, difficult algorithms and harder to maintain. So best place to focus is to start with clean data.
Optimize for Programmer Joy
There is a ton of data already existing in your organization, start collecting and categorizing it now. One way is to gather a data dictionary which could be as simple as just a list on the wiki of data information and links to their source.
Standardize – “We threw out non-Hadoop code that was faster” at LinkedIn. The code might of been faster but standardization was more important when the teams were all using the same code; communication and sharing was easier and productivity improved.
Examples
Drew Conway, Joseph Adler and Hilary Mason ran a cool data bootcamp tutorial, I only caught the second half after I walked out of one of the few poor talks. I wish I was in the data bootcamp all-day. I had that feeling a lot, there were just so many good talks going on all at once. They covered several examples of what you can do with data, from analyzing to graphing and mapping. You can download the entire Strata Bootcamp Code which includes all the data, code and their slides.
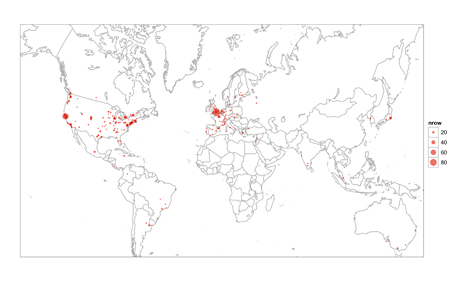
One example they showed was analysis of bit.ly links to the Strata conference site and graphed it onto a map, from the latitude and longitude where the links came from. The code, in R, is included in the github download, linked above.
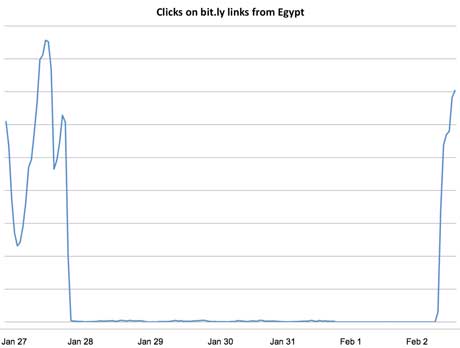
Hilary demoed something similar with bit.ly links coming out of Egypt, this was done in almost real-time, she made the graph an hour before her keynote talk, also done using R.
They also demoed some interesting tools for analyzing and classifying GMail. I need to dig more into their code to pick up on what I missed there.
LinkedIn demoed a mapping tool, which allows you to create a map of your professional network. Clustering common and inter-connections, which makes it easy to spot different companies and groupings of people. The tool was custom built using Processing. You can see my map below:
Tools
Here are a few links to some of the tools used, demoed or talked about:
- R Language – A statistical programming system including graphing and an extensive library to extend
- Choose the Right Chart – A simple tool to help you decide what type of chart to use.
- Wordle – A service to create beautiful word clouds
- Needlebase – An interesting tool that Marshall Kirkpatrick uses to scrape and categorize web sites, sounded awesome another thing to dig into. (Shutdown)
People
Here are a few links to some of the presenters and interesting people I met or saw:
- Joseph Adler, @jadler
- Hilary Mason, @hmason,
- Drew Conway, @drewconway, http://www.drewconway.com/zia/
- Mark Madsen, @markmadsen, http://thirdnature.net/
- Simon Rogers, @smfrogers,
- Jer Thorp, @blprnt,
- JJ Toothman, @jjtoothman,
Keynotes
The whole conference was recorded, I’m not sure if any of the individual sessions are publicly available but here are a few of the great keynotes, I’ll skip the blatant sales pitch ones, which unfortunately there were a couple.
- Mark Madsen, Third Nature The Mythology of Big Data [YouTube]
- DJ Patil, LinkedIn Innovating Data Teams [YouTube]
- Hilary Mason, bit.ly What Data Tells Us[YouTube]
- Werner Vogels, CTO Amazon Data Without Limits [YouTube]
Recommended Reading
- Visualizing Data by Bill Cleveland [Book, Amazon.com]
- The Fourth Paradigm: Data-Intensive Scientific Discovery [Book, Amazon.com]
- R in a Nutshell: A Desktop Quick Reference by Joseph Adler [Book, Amazon.com]
- The Data Deluge [Economist]
- Juice Analytics – Make People Fall in Love with Your Data [PDF, Slides]
Public Data Sets
Now you’ve done all your research, read about visualizations and want to play with some data. Here are a list of a few sources of publicly available data.
- Amazon Public Datasets
- US Government Data
- Guardian Datastore
- Nasdaq
- Infochimps Datamart (Shutdown)
This was just my view of the conference, like I said at the beginning there were many tracks and many more sessions than I could attend. If you were at the conference, feel free to include any additional information or links in the comments. Thanks to O’Reilly for putting on the first of what I hope to many interesting data conferences to come.