Data Science
A few notes, resources, and examples on using Python for data science and analysis.
Load Data from Text File
An example loading comma delimited data into a Numpy array.

```python
import numpy as np
data: np.loadtxt(open('comma_delim.csv'), delimiter=",")
Data Analysis
You can use numpy to do some quick data analysis.
Median and Average
Use np.median() and np.average() to calculate the median and average for a set of data.
import numpy as np
import random

# sample data
nums = [random.randint(1, 1000) for _ in range(10)]

a = np.array(nums)
print(f"Median: {np.median(a)}")
print(f"Average: {np.average(a)}")
Percentile
Use numpy percentile function to calculate percentiles for a set of data.
# sample data
data = np.array(range(10, 91))

# calculate 10th, 25th, 50th, 75th, and 90th
for per in [10, 25, 50, 75, 90]:
    perc = np.percentile(data, per)
    print(f"{per}th => {perc:.0f}")

# 10th => 18.00
# 25th => 30.00
# 50th => 50.00
# 75th => 70.00
# 90th => 82.00
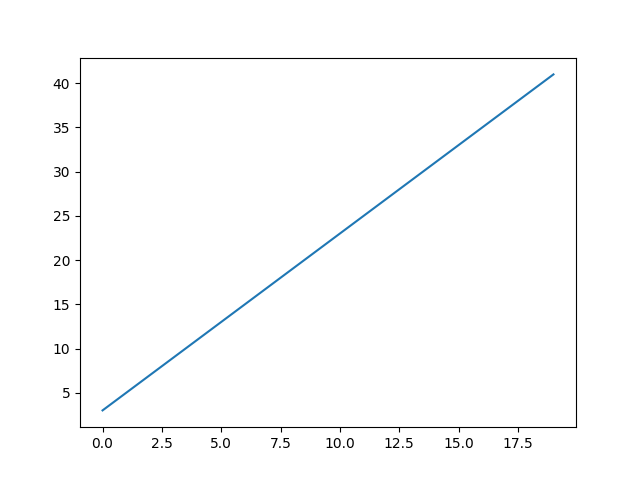
Plotting and Graphing
Line Graph
import math
import matplotlib.pyplot as plt

# line with slope m=2
X = [n for n in range(0, 20)]
Y = [ 2 * x + 3 for x in X]
plt.plot(X,Y)

# save graph to file
plt.savefig("line-graph.png", dpi=150)
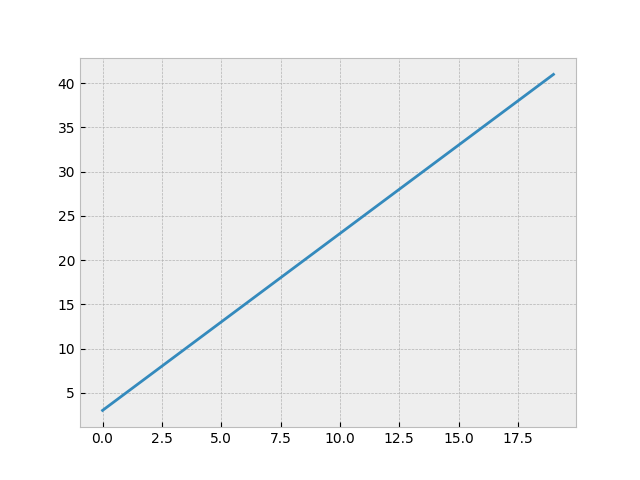
Graph Stylesheets
Style your matplotlib graphs by using a stylesheet. The matplotlib documentation has a few example stylesheets to preview and download.
Download the stylesheet and place in the same directory as your code. The line graph example using bmh stylesheet, add the following at the top:
plt.style.use('bmh')
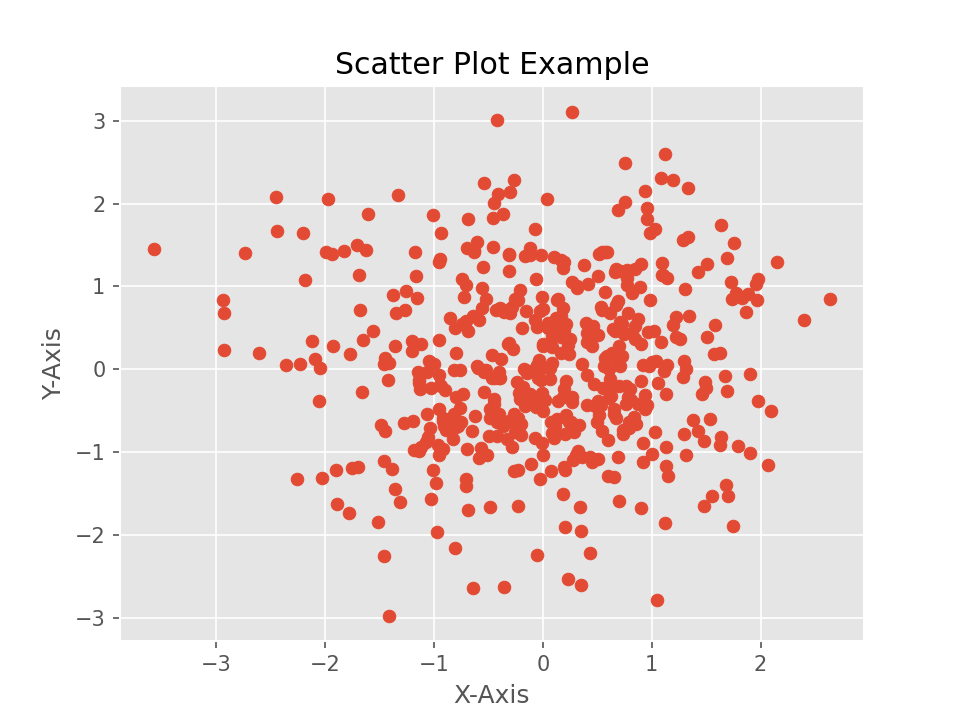
Scatter Plot
An example of a scatter plot adding title, labels, and axes and using the ggplot style sheet.
import numpy as np
import matplotlib.pyplot as plt
plt.style.use("ggplot")

# random data
X = np.random.normal(0, 1, 500)
Y = np.random.normal(0, 1, 500)

plt.scatter(X,Y)
plt.title("Scatter Plot Example")
plt.xlabel("X-Axis")
plt.ylabel("Y-Axis")

# save graph to file
plt.savefig("scatter-ggplot.png", dpi=150)